
Data Visualisation.
Go beyond graphs: gain insights.
Transform storytelling.
Bring data to life.
Data visualisation helps turn your data into insights. A lot of good organisations achieve a lot of great things. But very few are great at communicating these wins, nor the numbers behind them. We are experts in visualising data.
With almost a decade of experience in social and environmental projects, we know how best to communicate your strategy, promote your goals and show-off your impacts to the masses. At Whale Shark Creative, we make information beautiful.
-
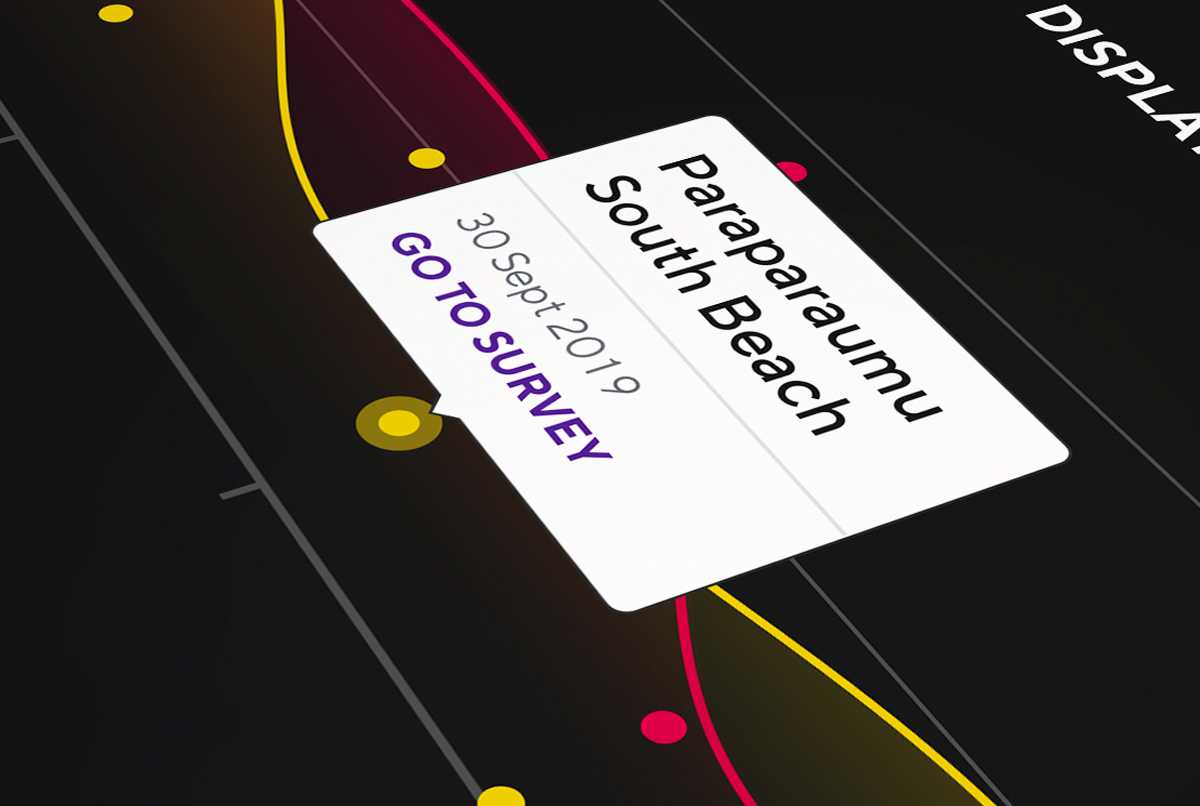 Data Visualisation for Litter Intelligence
Data Visualisation for Litter Intelligence
March 27, 2020
-
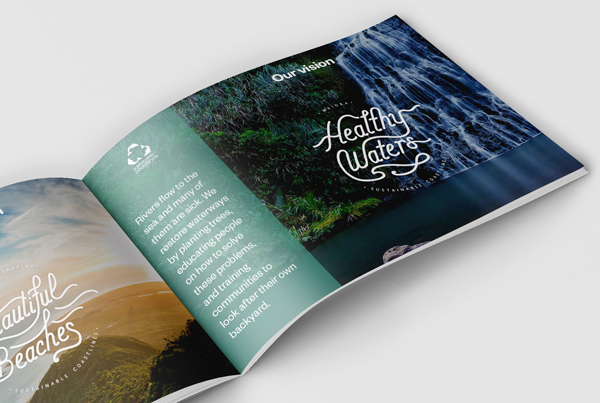 Statement of Service Performance, Sustainable Coastlines 2016
Statement of Service Performance, Sustainable Coastlines 2016
November 22, 2017
-
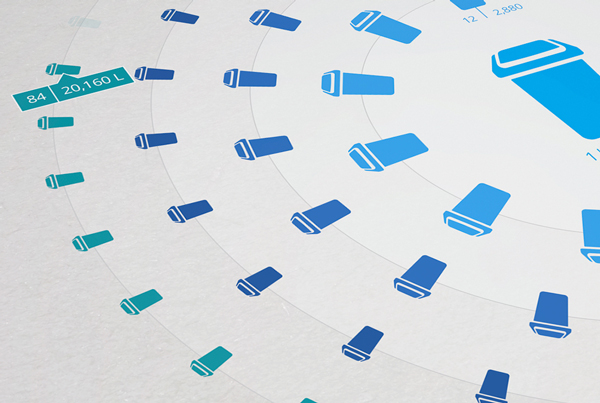 Project Impact Infographics
Project Impact Infographics
June 22, 2015
-
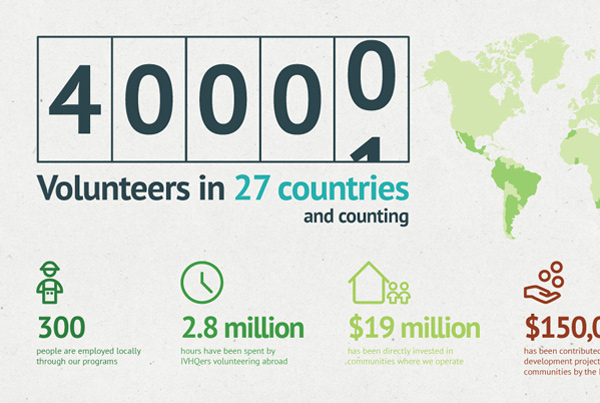 40,000 Volunteers Infographic
40,000 Volunteers Infographic
December 15, 2014
-
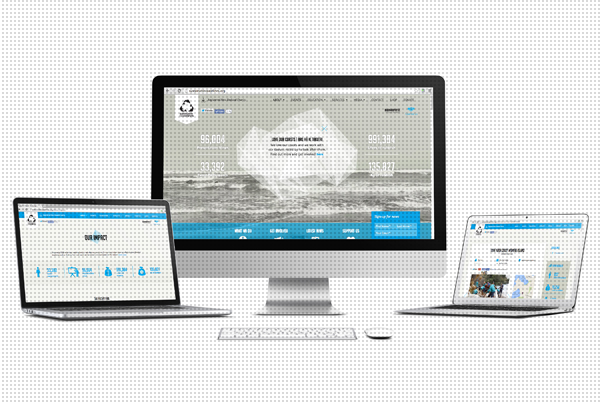 Sustainable Coastlines website
Sustainable Coastlines website
March 23, 2014